Measuring Market Power

Recall, market power is the ability of a firm to raise p>MC
Measures of market concentration
- Concentration Ratios
- Herfindahl-Hirschman Index
Measures of markup pricing
- Lerner Index
The New Empirical Industrial Organization
- importance of econometrics
Market Concentration
Real world markets fall between the polar extremes of our models of perfect competition and monopoly
Concentration measures allow us to gauge the proximity of a market to either extreme
- Easy to compare
- Assist in market regulation
Often ∈[0,1]
- 0 ⟹ perfect comepetition
- 1 ⟹ monopoly
Market Concentration Measures
- Good measure of market concentration meets:
Principle of Transfer of Sales: a transfer of sales from a small firm to a large firm should increase concentration
Entry condition: entry (exit) of a small firm (holding constant the relative shares of existing firms) should decrease (increase) concentration
Merger condition: merger of 2 or more firms should increase concentration
- Transfer of sales + exit of smallest firm (each raises concentration)
Measuring Market Concentration: Concentration Ratio
- An industry's concentration ratio (CR) adds the market share of the largest n firms, e.g.
CRn=n∑i=1si
- where si=qiQ, that firm's fraction of total industry sales
- Common concentration ratios:
- CR4
- CR8
Measuring Market Concentration: Concentration Ratio
Problems with CR's:
n is arbitrarily chosen (2? 4? 8?)
Does not follow transfer of sales principle
- e.g. Firm 1 gaining 0.20 and Firm 3 and 4 each losing 0.10 doesn't change CR4!
No weighting by size
Measuring Market Concentration: HHI
- Herfindal-Hirschman Index (HHI): measures the sum of the squares of market share of all firms in an industry
HHI=n∑i=1s2i
- Where si=qiQ
- Why squared? Gives more weight to firms with more market share (unlike CR)
Measuring Market Concentration: HHI
HHI∈[0,1]
Monopoly HHI=1
Perfect competition: HHI=1n→0
- n firms of equal size
Measuring Market Concentration: HHI
- Equivalent number n∗, number of equal-sized firms in a hypothetical market that would give rise to the same HHI as observed
n∗=1HHI
HHI=0.2⟹1HHI=5 equal sized firms
HHI=0.8⟹1HHI=1.25 equal sized firms
Measuring Market Concentration: HHI
HHI (in percentages)=10,000n∑i=1s2i
HHI is often measured in percentage form by U.S. antitrust authorities
- Market shares as percentages instead of decimals
Here, HHI∈[0,10,000]
- Monopoly: HHI = 10,000, 1 firm with 100% market share ⟹1002=10,000)
Measuring Market Concentration: HHI
- If two firms, with market share s1 and s2, merge, HHI increases by (s1+s2)2−s21−s22=2s1s2
Recall: Lerner Index and Inverse Elasticity Rule

- Lerner Index measures market power as % of firm's price that is markup above MC(q)
L=p−MC(q)p=−1ϵD
- i.e. L×100% of firm's price is markup
- L=0⟹ perfect competition
- (since P=MC)
- As L→1⟹ more market power
Recall: Lerner Index and Inverse Elasticity Rule
L=p−MCp=−1ϵD
This simple formula only works for a monopoly (n=1)!
Lerner Index and Cournot Theorem
- Consider Cournot competition between n firms with identical costs MCi, the Lerner index actually becomes:
L=p−MCip=−siϵD
Where si=qiQ
- Note monopoly is special case where qiQ=1!
Lerner Index and Cournot Theorem
L=p−MCip=−siϵD
Alternatively, since si=1n:
L=p−MCip=−1nϵD
Lerner Index and Cournot Theorem
L=p−MCip=−siϵD=−1nϵD
Market power is inversely related to price elasticity of demand
- Larger (smaller) ϵ, smaller (larger) markup p−MC
Market power is inversely related to the number of competitors
- Greater number of competitors ↑n, smaller si, and hence less market power
Lerner Index and Cournot Theorem
n∑i=1sip−MCip=−∑ni=1s2iϵD=−HHIϵD
Can add up all of the market-share-weighted markups
Equivalent to HHI divided by price elasticity
Some Estimates

Some Estimates

DOJ on HHI

"The agencies generally consider markets in which the HHI is between 1,500 and 2,500 points to be moderately concentrated, and consider markets in which the HHI is in excess of 2,500 points to be highly concentrated.
"Transactions that increase the HHI by more than 200 points in highly concentrated markets are presumed likely to enhance market power under the Horizontal Merger Guidelines issued by the Department of Justice and the Federal Trade Commission."
Department of Justice, 2017, HHI
Industry Classification

NAICS used by statistical agencies such as the U.S. Census to classify industries
Places production into one of 1,004 4-digit industries, defined nationally
Do not accurately correspond to economic markets
- May include some products clearly not substitutes, or leave out some products that clearly are substitutes
- Hence, should not be assumed to match properly with HHI measures
Market Definition
"The Agencies employ the hypothetical monopolist test to evaluate whether groups of products in candidate markets are sufficiently broad to constitute relevant antitrust markets. The Agencies use the hypothetical monopolist test to identify a set of products that are reasonably interchangeable with a product sold by one of the merging firms.
Department of Justice, 2010, Horizontal Merger Guidlines
Market Definition
"The hypothetical monopolist test requires that a product market contain enough substitute products so that it could be subject to post-merger exercise of market power significantly exceeding that existing absent the merger. Specifically, the test requires that a hypothetical profit-maximizing firm, not subject to price regulation, that was the only present and future seller of those products ('hypothetical monopolist') likely would impose at least a small but significant and non-transitory increase in price ('SSNIP') on at least one product in the market, including at least one product sold by one of the merging firms. For the purpose of analyzing this issue, the terms of sale of products outside the candidate market are held constant. The SSNIP is employed solely as a methodological tool for performing the hypothetical monopolist test; it is not a tolerance level for price increases resulting from a merger."
Department of Justice, 2010, Horizontal Merger Guidlines
Can We Measure Market Power from Prices?
- Can we tell a collusive market from a competitive one?
L=p−MCp=−1ϵD
We can only observe p's and q's
Could be Bertrand price competition, firms setting p=MC
- Or it could be a cartel splitting monopoly profits by fixing the price
Data problems: we never know MC!
Empirical Challenge: Identifying Market Power from Prices

L=p−MCp
Imagine we observe a market with n sellers all charging price p and selling quantity q
Two possible explanations:
- The market is competitive, and all firms are charging p=MC
- The market is a cartel, and all firms are marking up p>MC
Empirical Challenge: Identifying Market Power from Prices
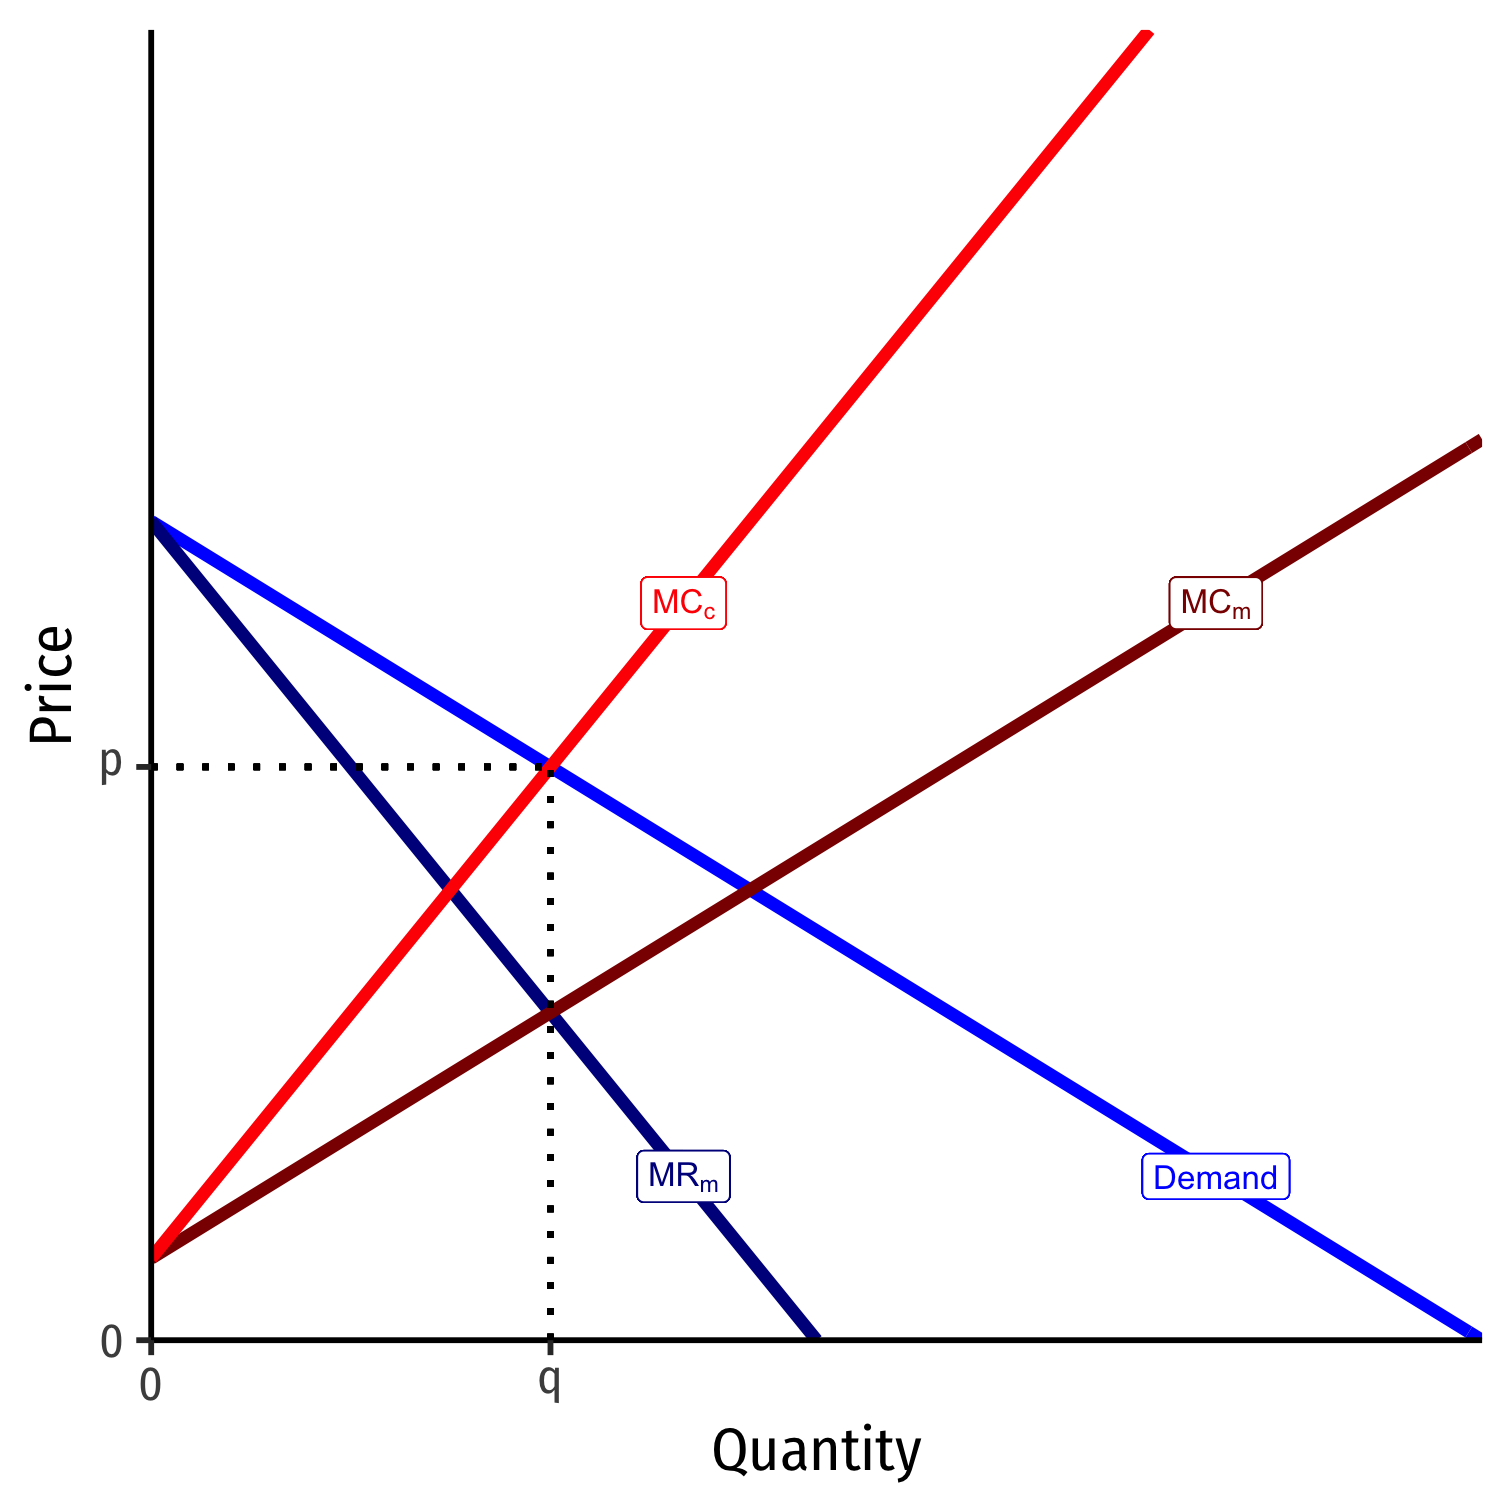
- We can rationalize each explanation as follows:
Competitive firms have (higher) MCc and are setting it equal to demand to get p at quantity q
Cartel has (lower) MCm at quantity q, sets it equal to MRM=m, marking price up to p
Empirical Challenge: Identifying Market Power from Prices
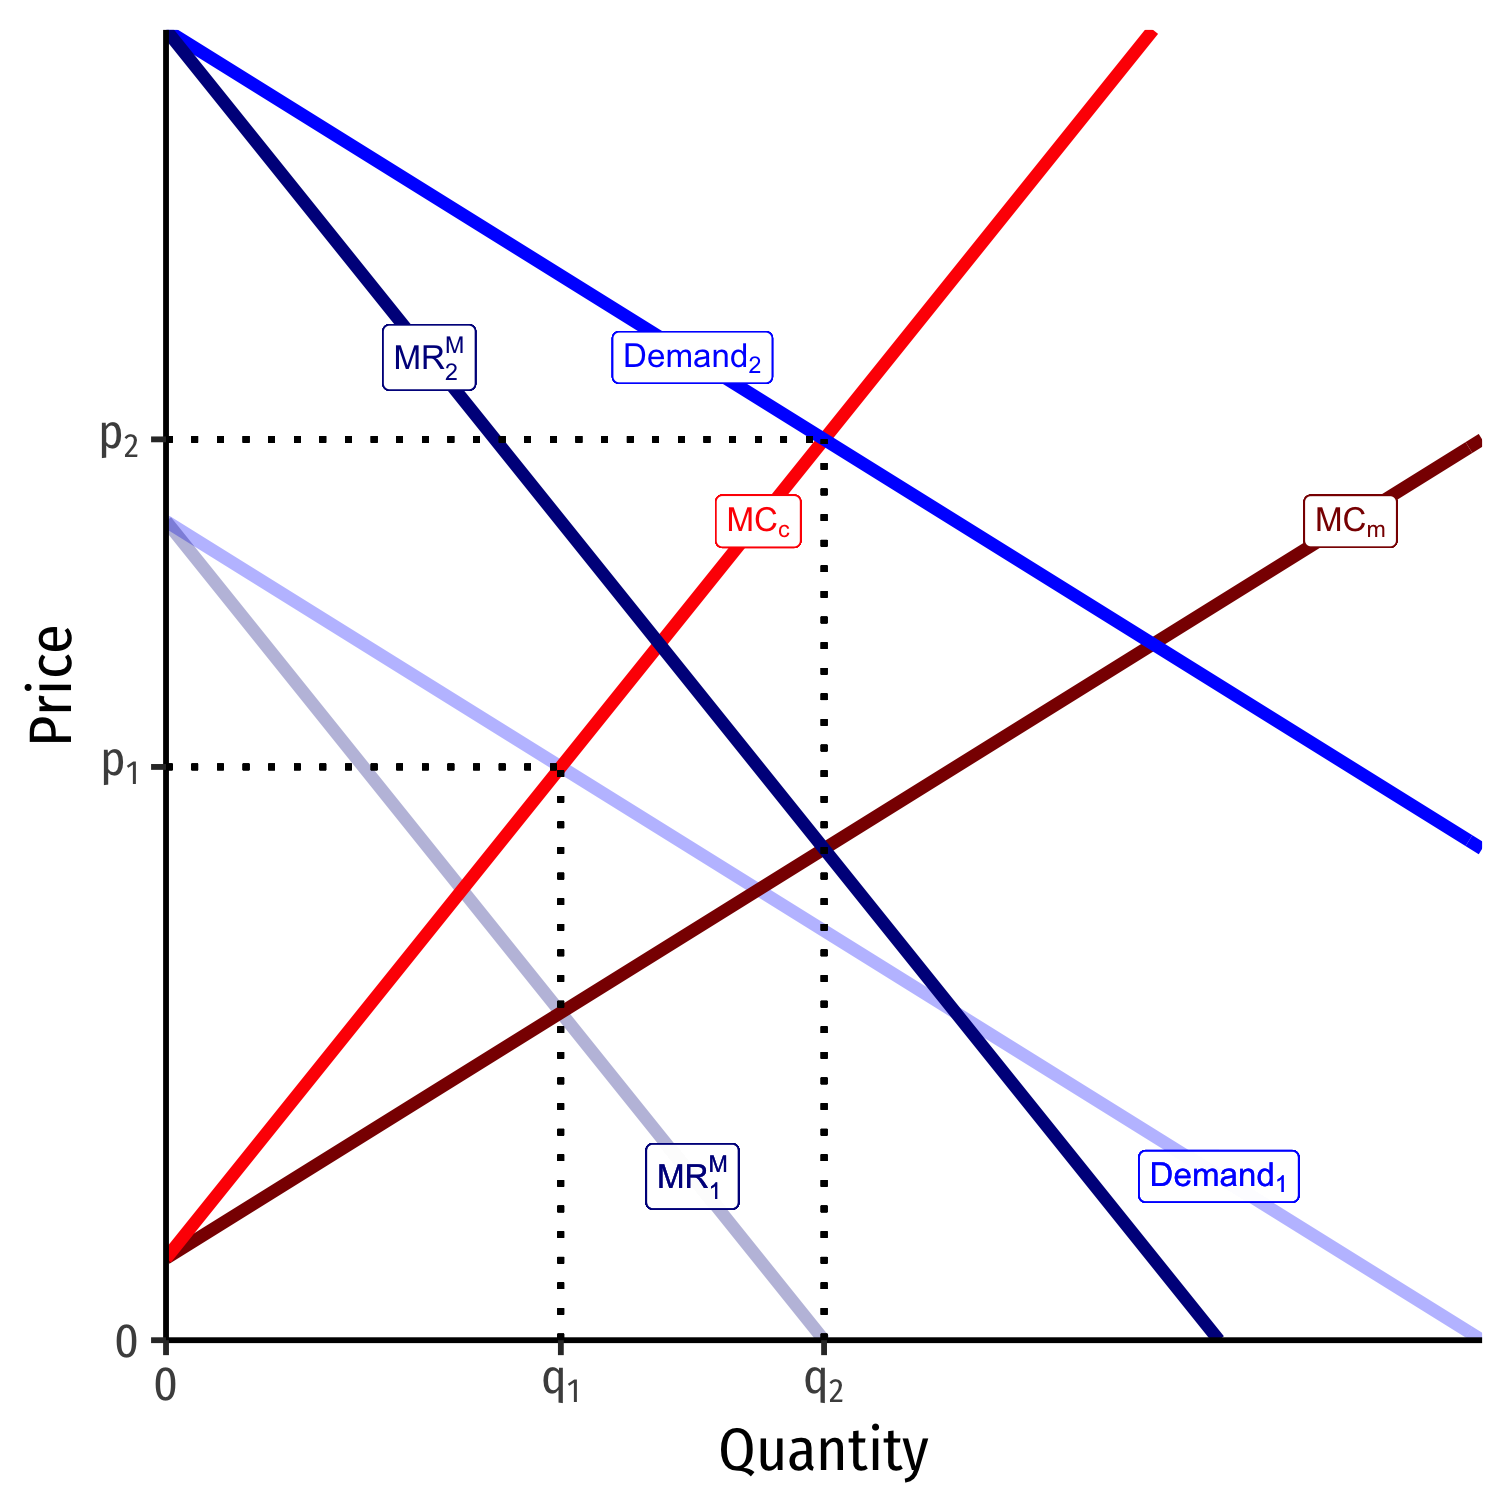
- What if Demand shifts to Demand 2? Same problem!
Competitive firms set MCc equal to new demand 2 to get p2 at q2
Cartel sets MCM equal to new MRM2 at q2, mark up to p2
- Changes in demand cannot identify market power
Empirical Challenge: Identifying Market Power from Prices
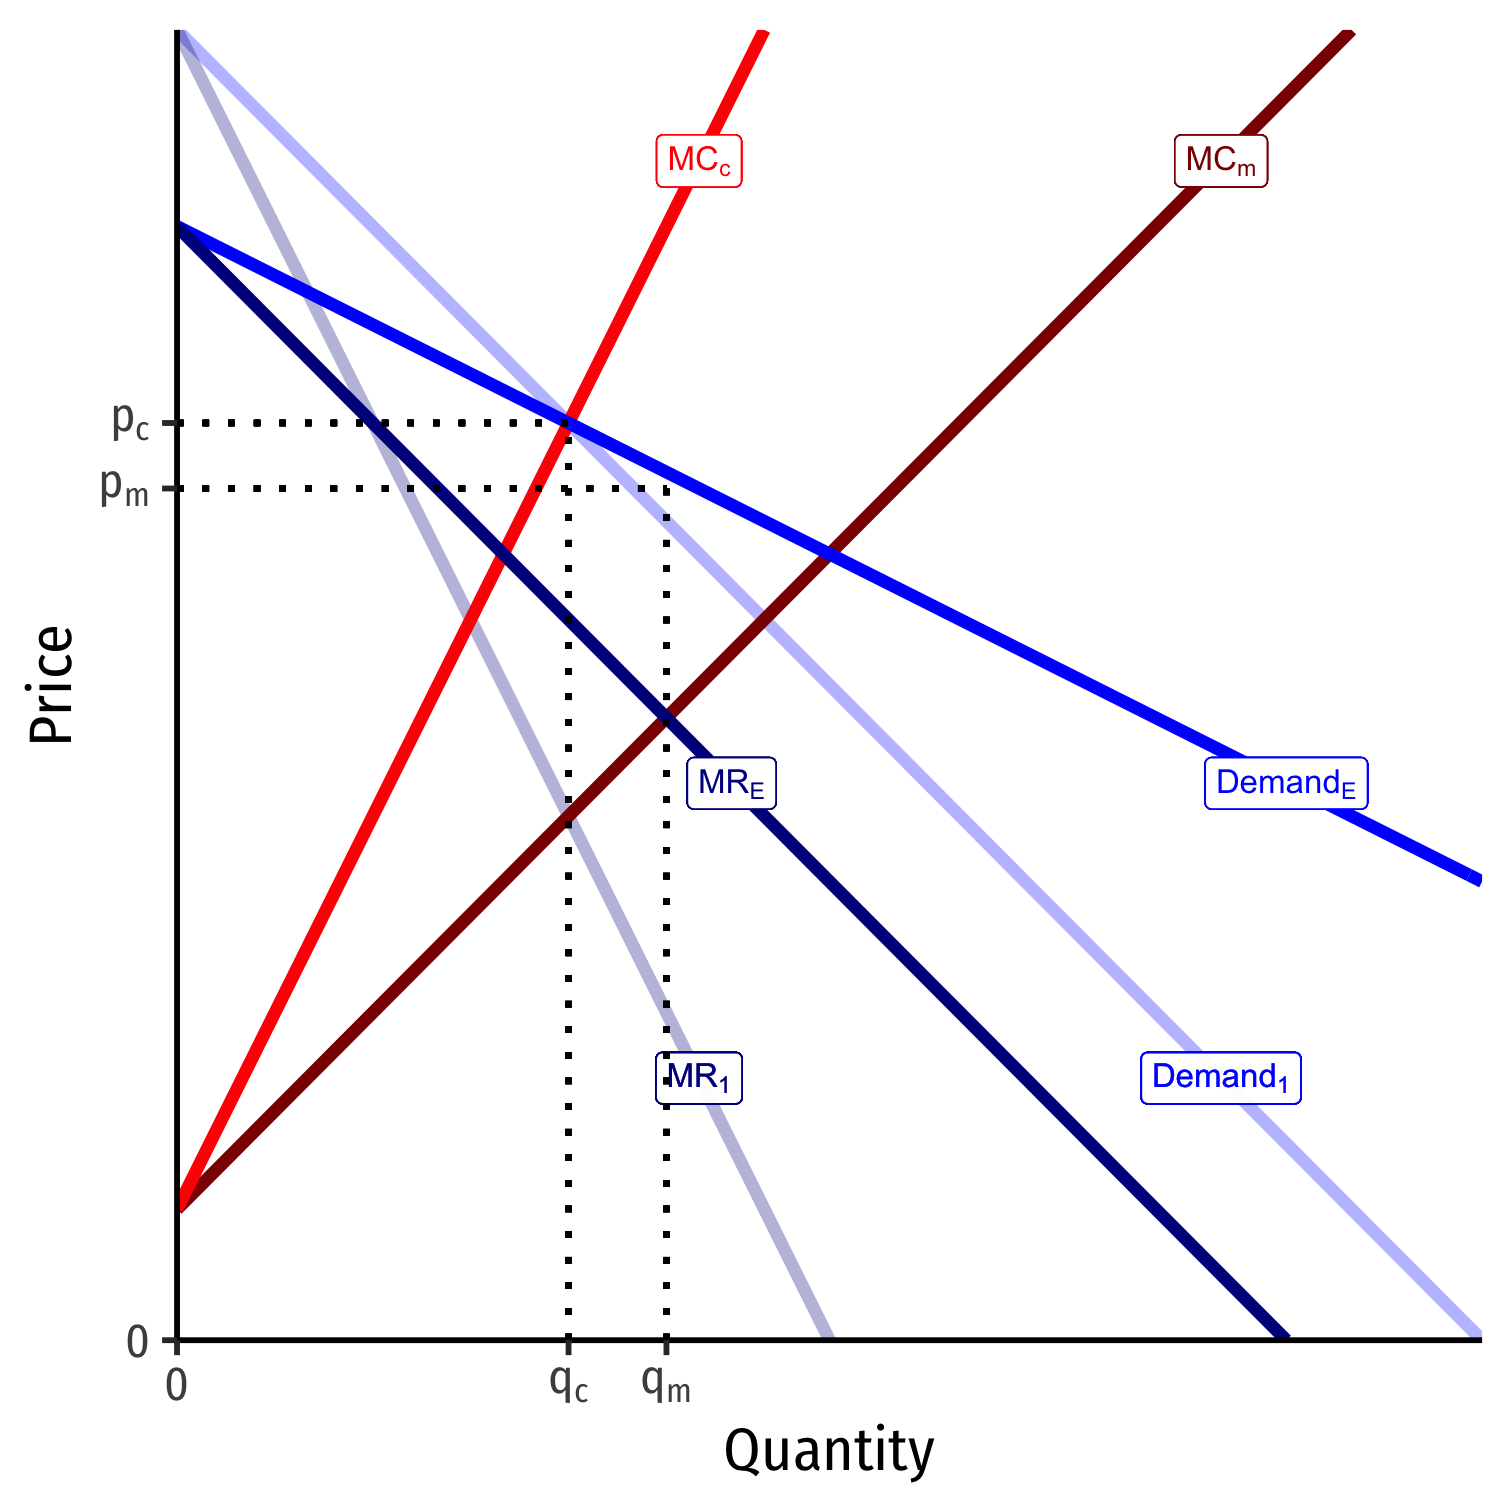
Potential solution famously identified by Bresnahan (1982):
If demand rotates around a price (i.e. becomes more elastic)
Competitive firms don't change p or q (MCc still intersects Demand at same point!)
Cartel changes to pm and qm since MR will change (and hence, intersection of MCm=MR)
"Translations [i.e. shifting] of the demand curve will always trace out a supply relation. Rotations of the demand curve around the equilibrium point will reveal the degree of market power," (Bresnahan 1982)
Empirical Challenges: Estimating Demand & Elasticity
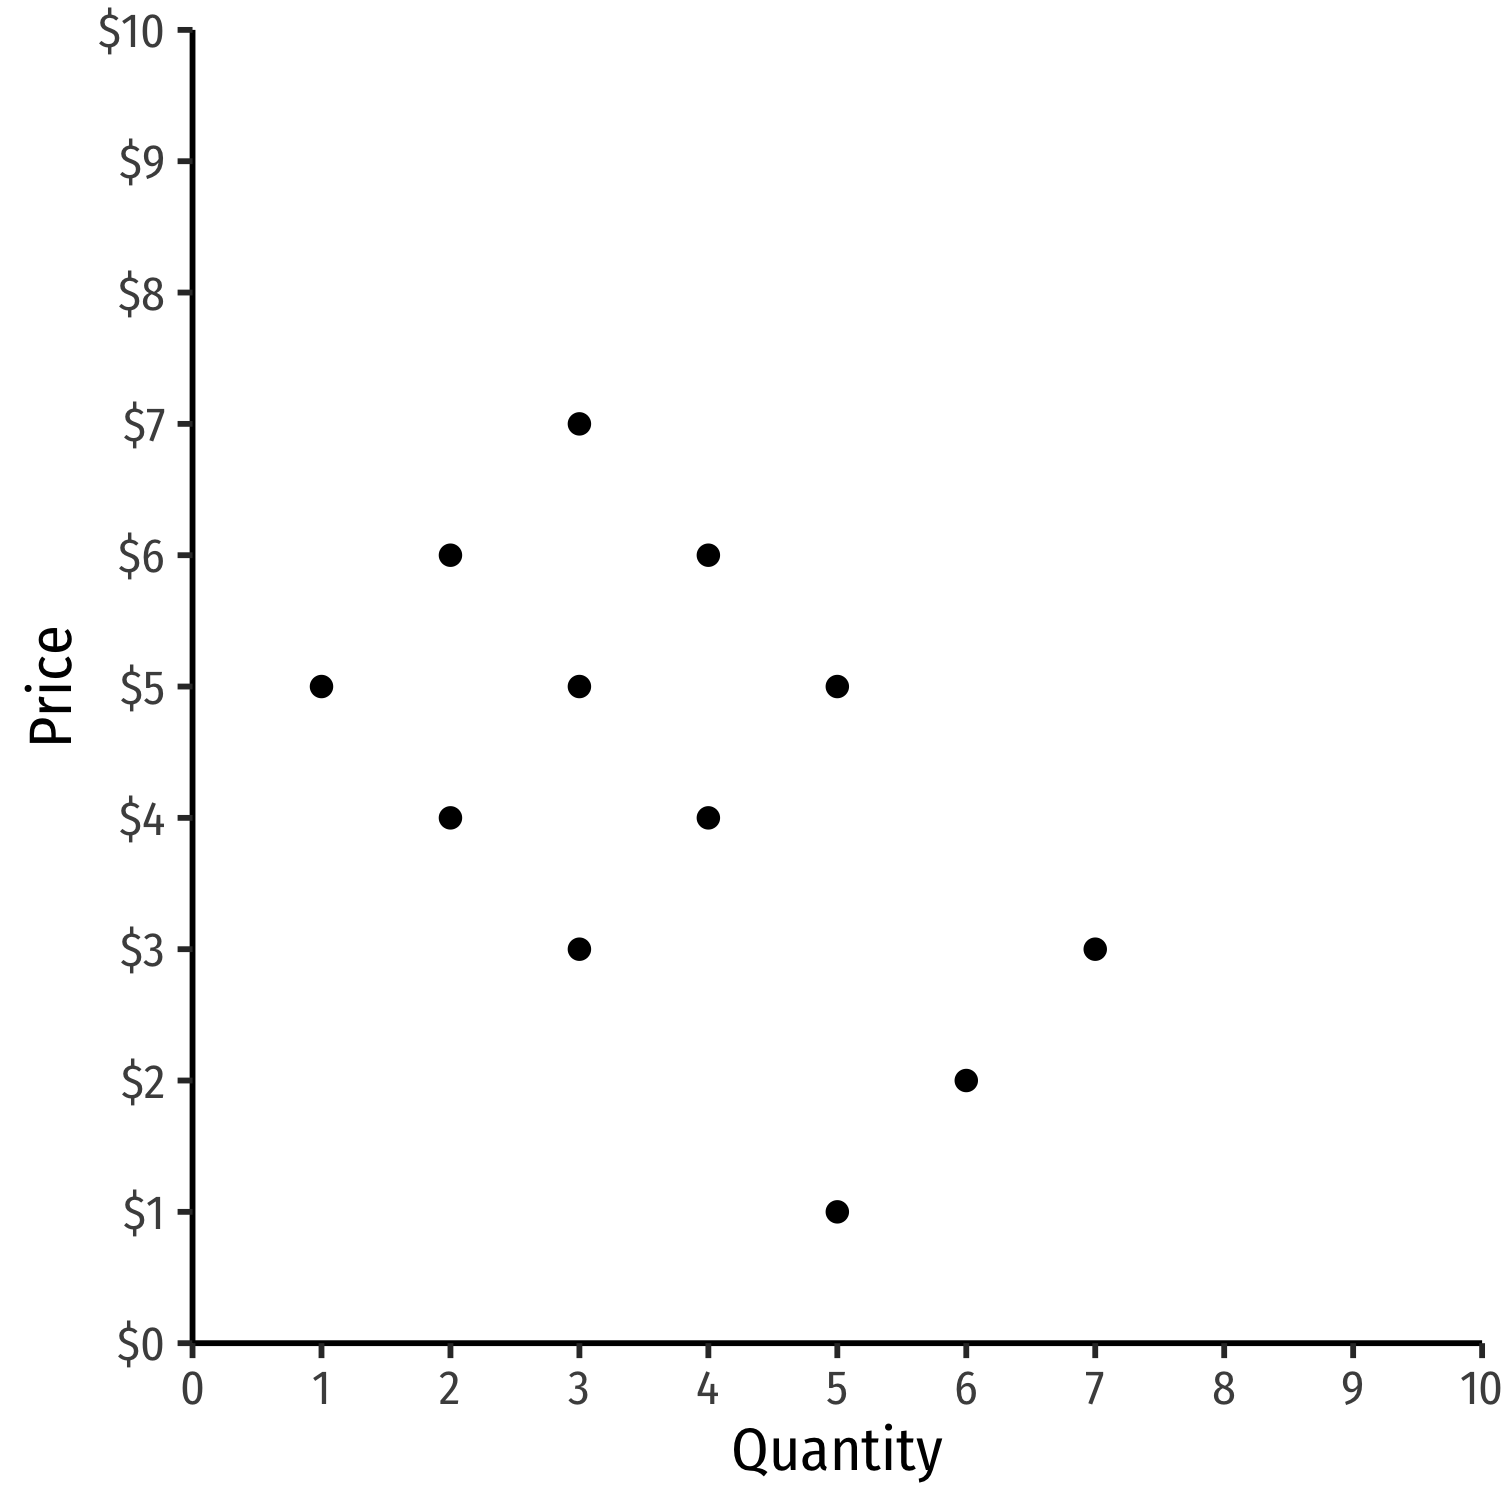
Suppose we have price and consumption data for an industry
Fairly easy to acquire
Empirical Challenges: Estimating Demand & Elasticity
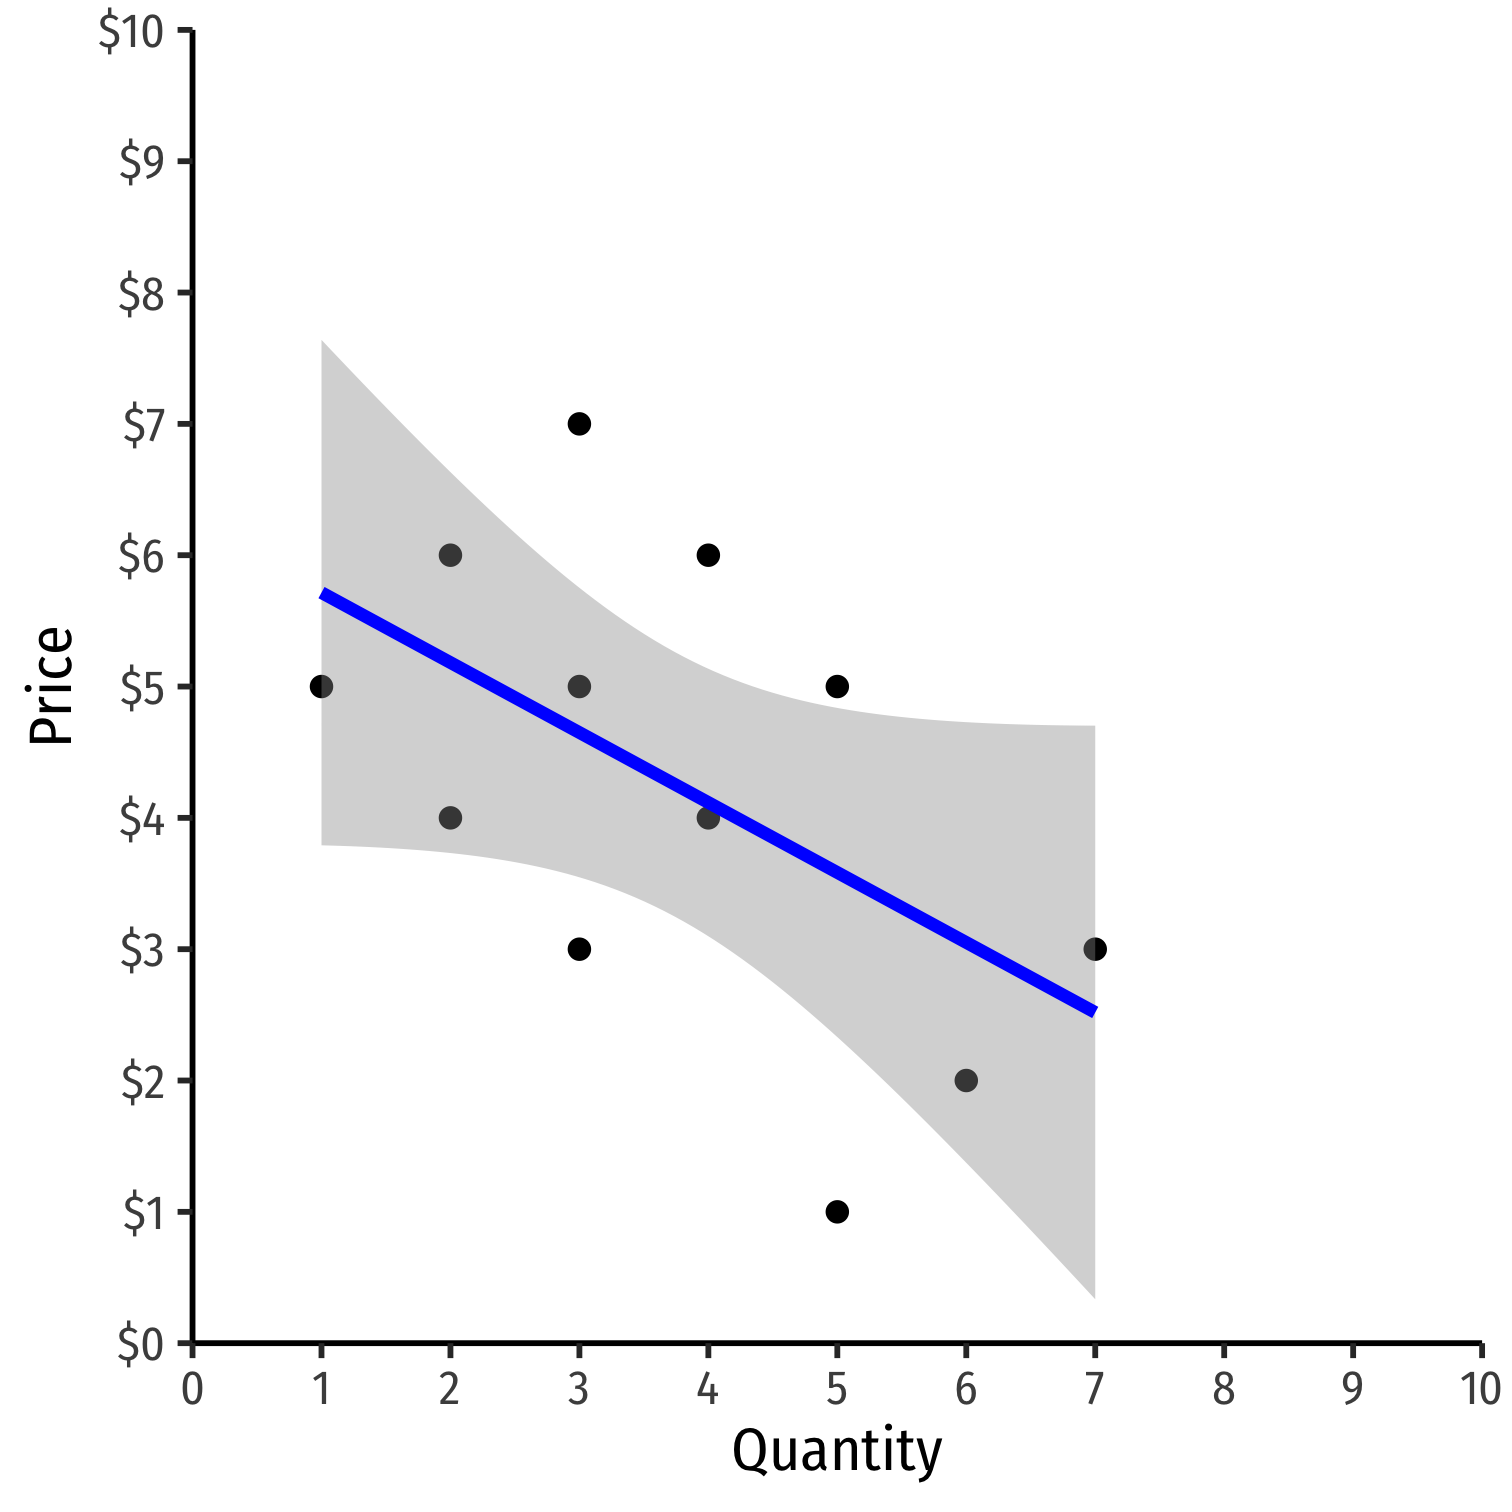
Suppose we have price and consumption data for an industry
Fairly easy to acquire
Why can't we estimate the demand curve with a simple regression here?
ln(Quantityit)=β0+β1ln(Priceit)+ϵit
- With natural logs, β1 is the price elasticity of Demand
Empirical Challenges: Estimating Demand & Elasticity
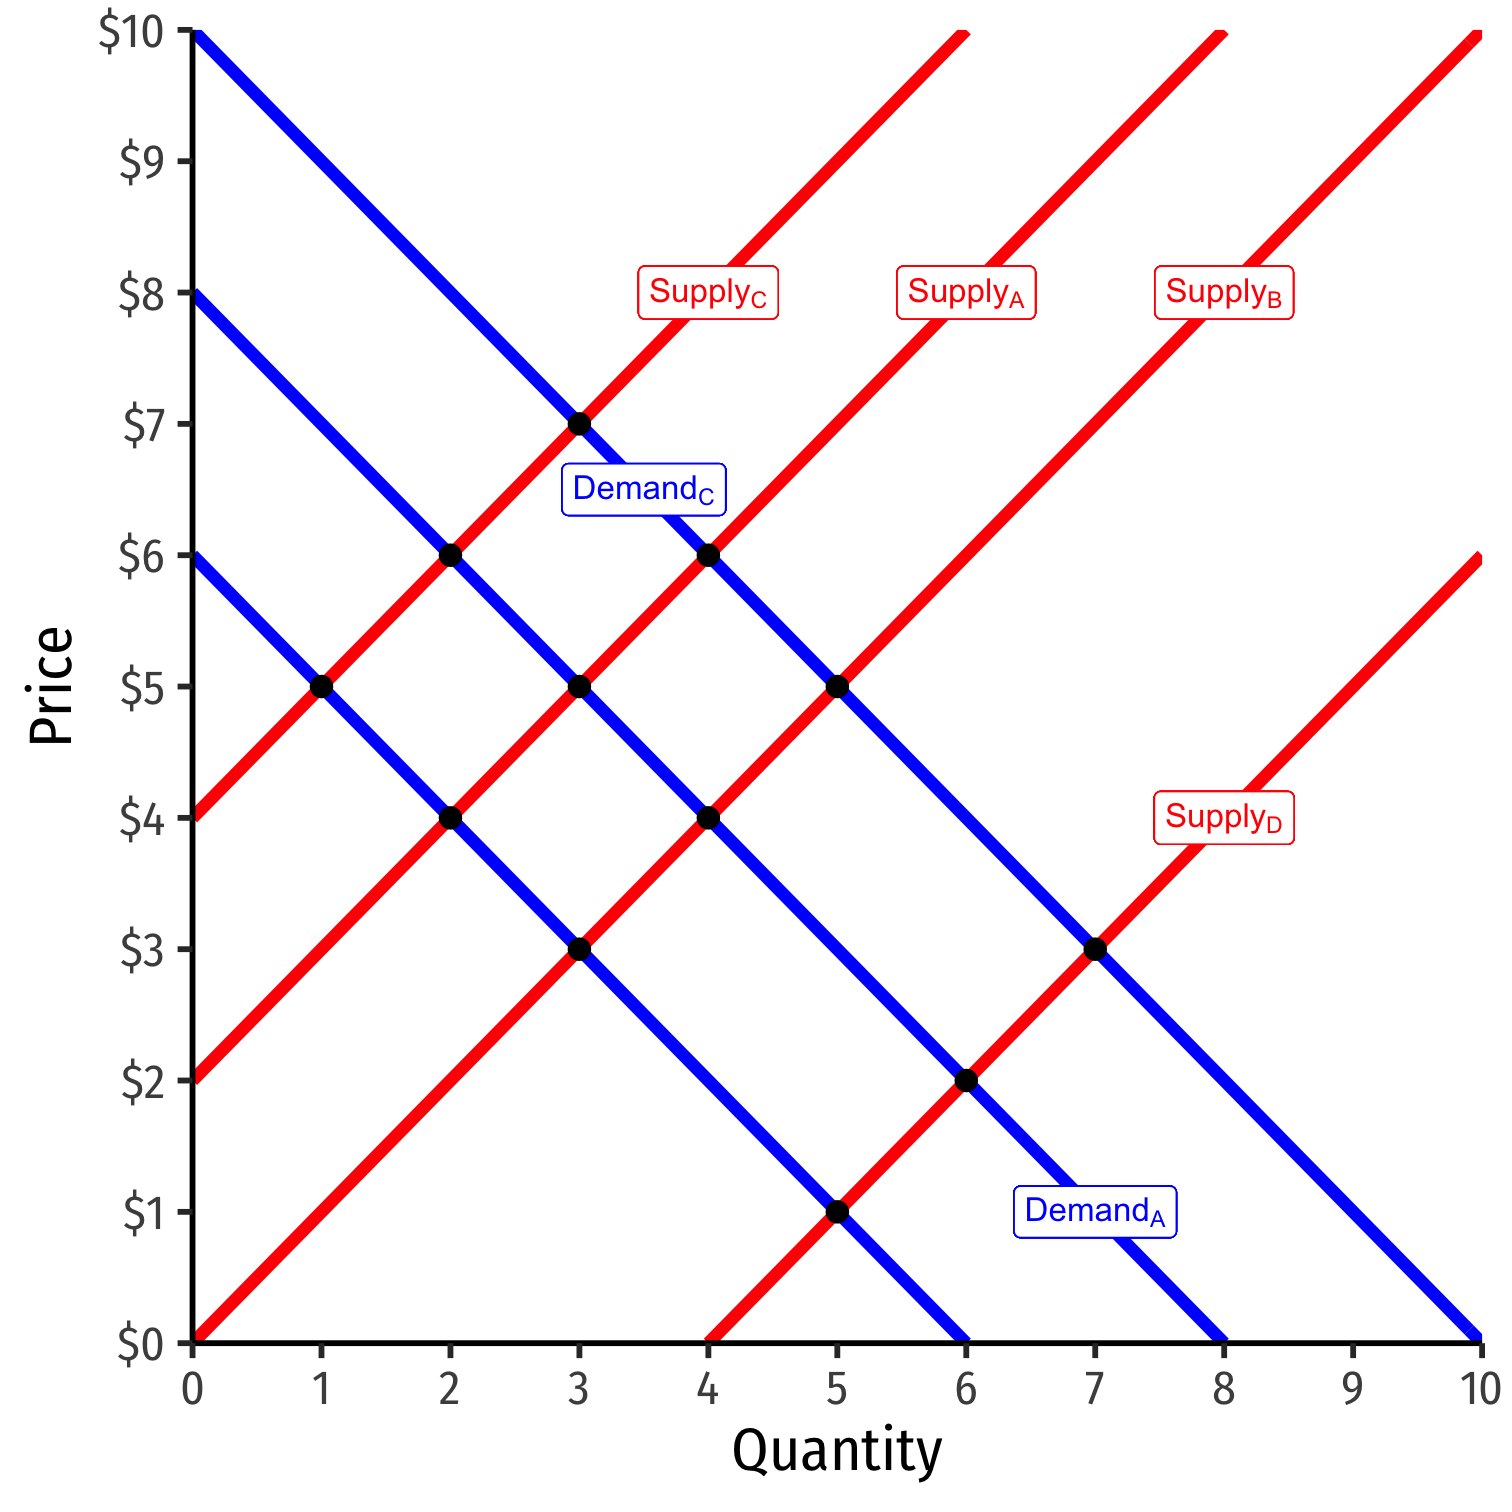
What we are actually looking at are a series of equilibrium (Q∗,P∗) points!
Result of many demand and supply curve shifts & intersections!
Empirical Challenges: Estimating Demand & Elasticity

QD=α0+α1P+α2M+uD
Why can't we just estimate price elasticity of demand (α1) with the demand equation?
P is partially a function of quantity supplied!
Empirical Challenges: Estimating Demand & Elasticity
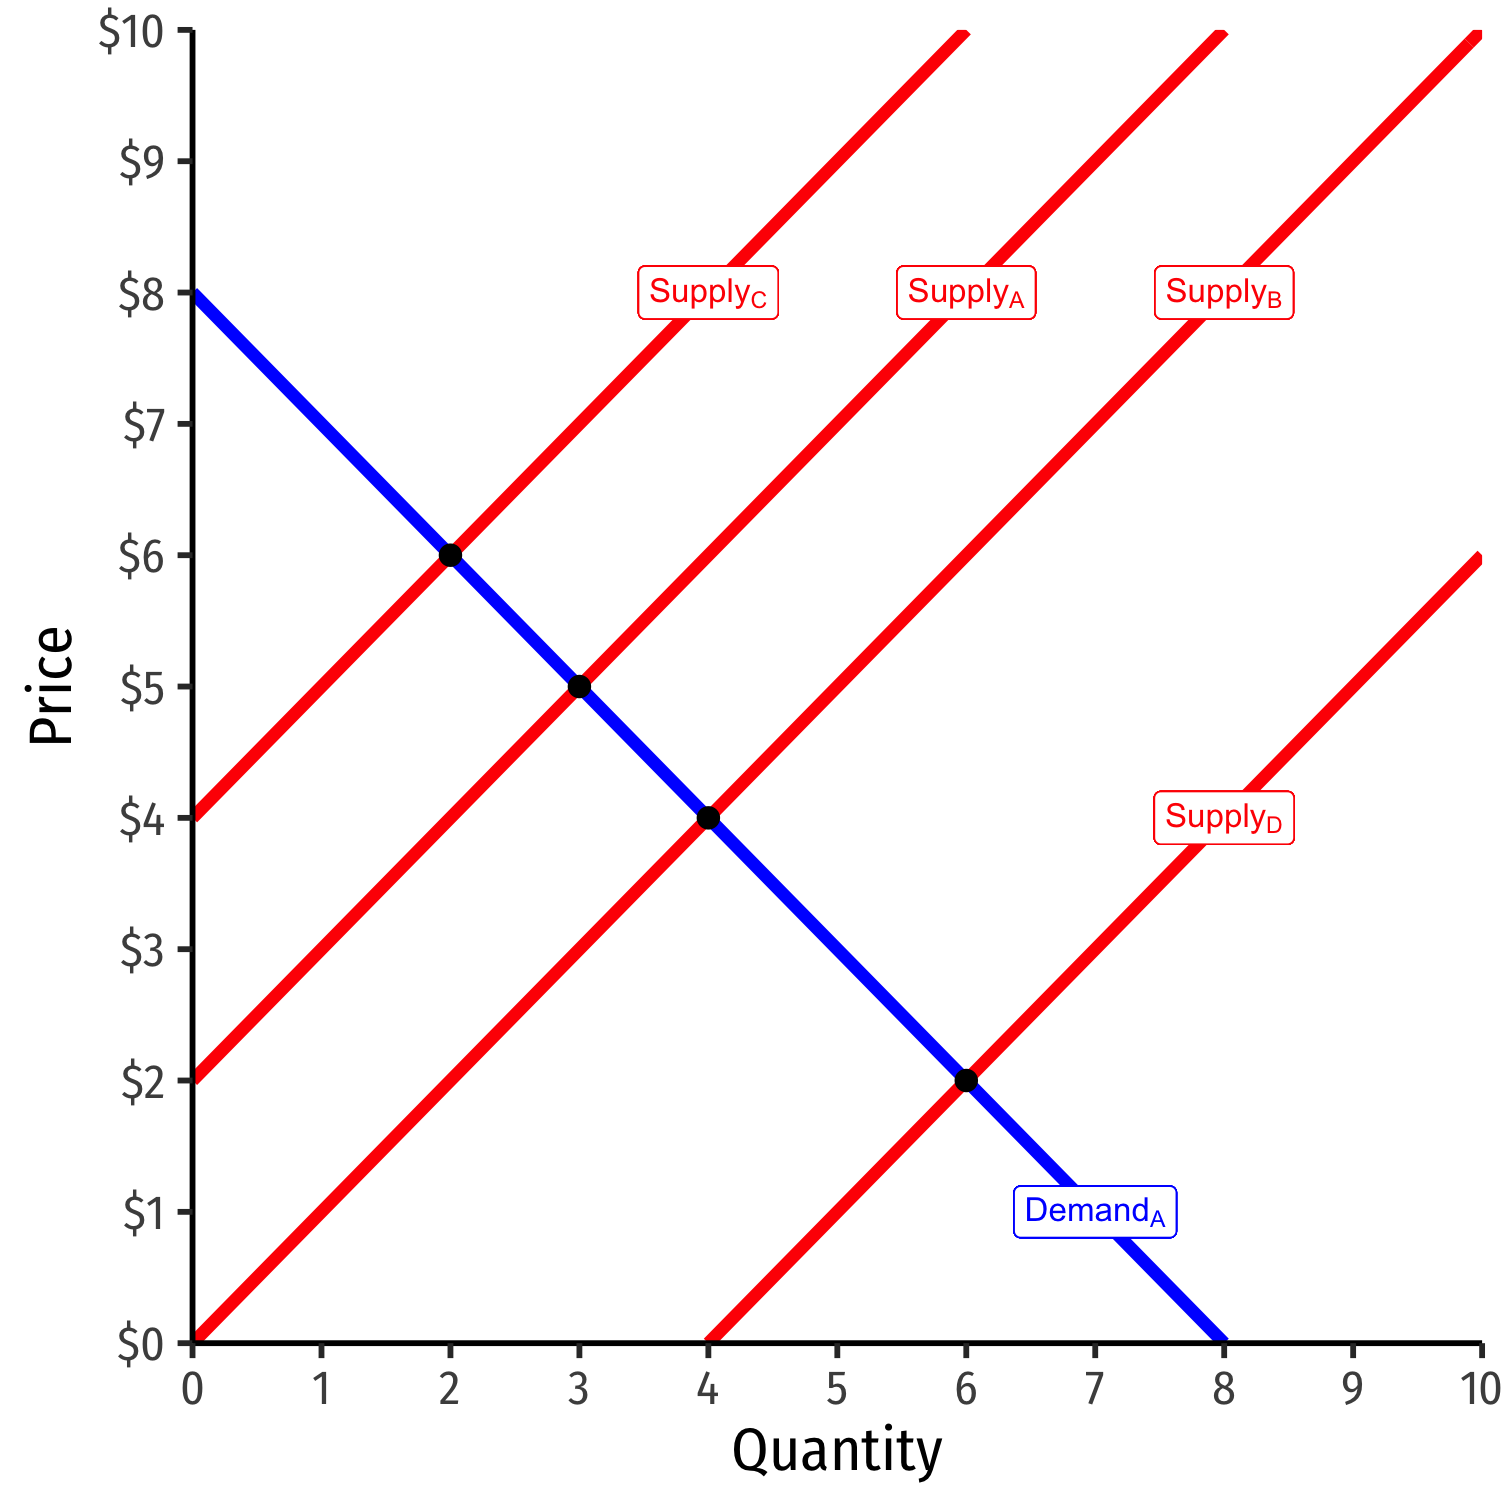
Instrumental variables and 2-stage least squares techniques to identify demand relationship
Often use some supply shifter (like cost changes, C) correlated with price P, but not correlated with uD
Essentially: traces out unique demand relationship by allowing supply to vary & shift
Then, can estimate demand elasticity β1
The New Empirial Industrial Organization

"New Empirical Industrial Organization" (NEIO)
Focus on data, econometrics, machine learning, merger simulations
Private businesses, law firms, consulting firms, and government agencies (FTC, DOJ) hire economists trained in econometrics and IO for antitrust research, expert testimony